
$55K added,
on $9,140 of spend
Lavilin

The situation
We met Lavilin at CHFA 2025. The conversation started on the show floor, walking through where the growth was sitting and what it would take to get at it, and the account followed from there.
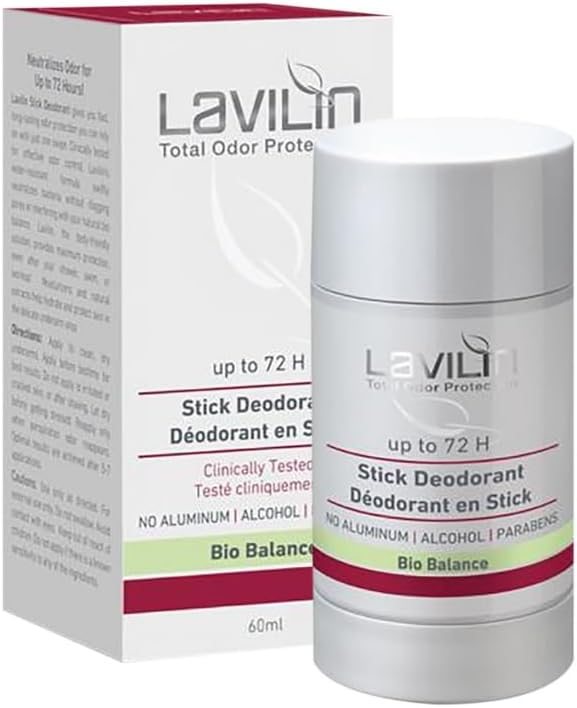
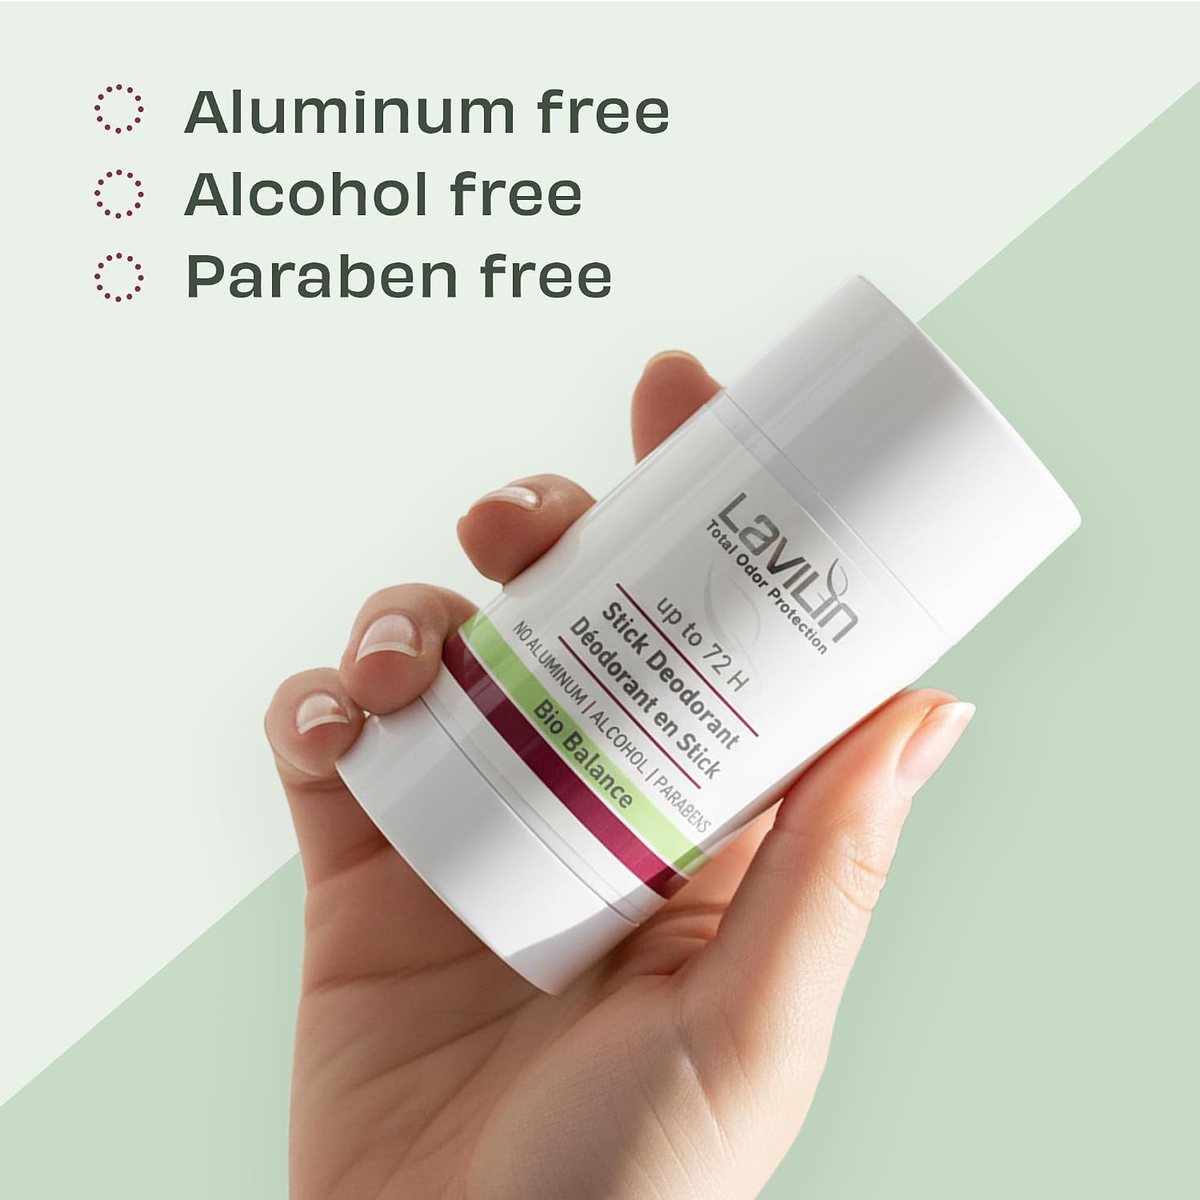
Lavilin makes probiotic deodorant. Bio Balance technology that works with the skin's microbiome instead of blocking sweat, aluminium and alcohol free, clinically tested to 72 hours. It is genuinely differentiated in a category owned by a handful of enormous brands.
None of that was reaching the shopper. The listing did not explain what Bio Balance is, why probiotic deodorant behaves differently from an antiperspirant, or what the 72-hour claim rests on. And with no advertising running, the number of people who ever saw the page was small to begin with.
We took over the account on 1 October 2025 with a mandate to build both sides: a listing that could carry the science, and the traffic to put it in front of people.
What we did
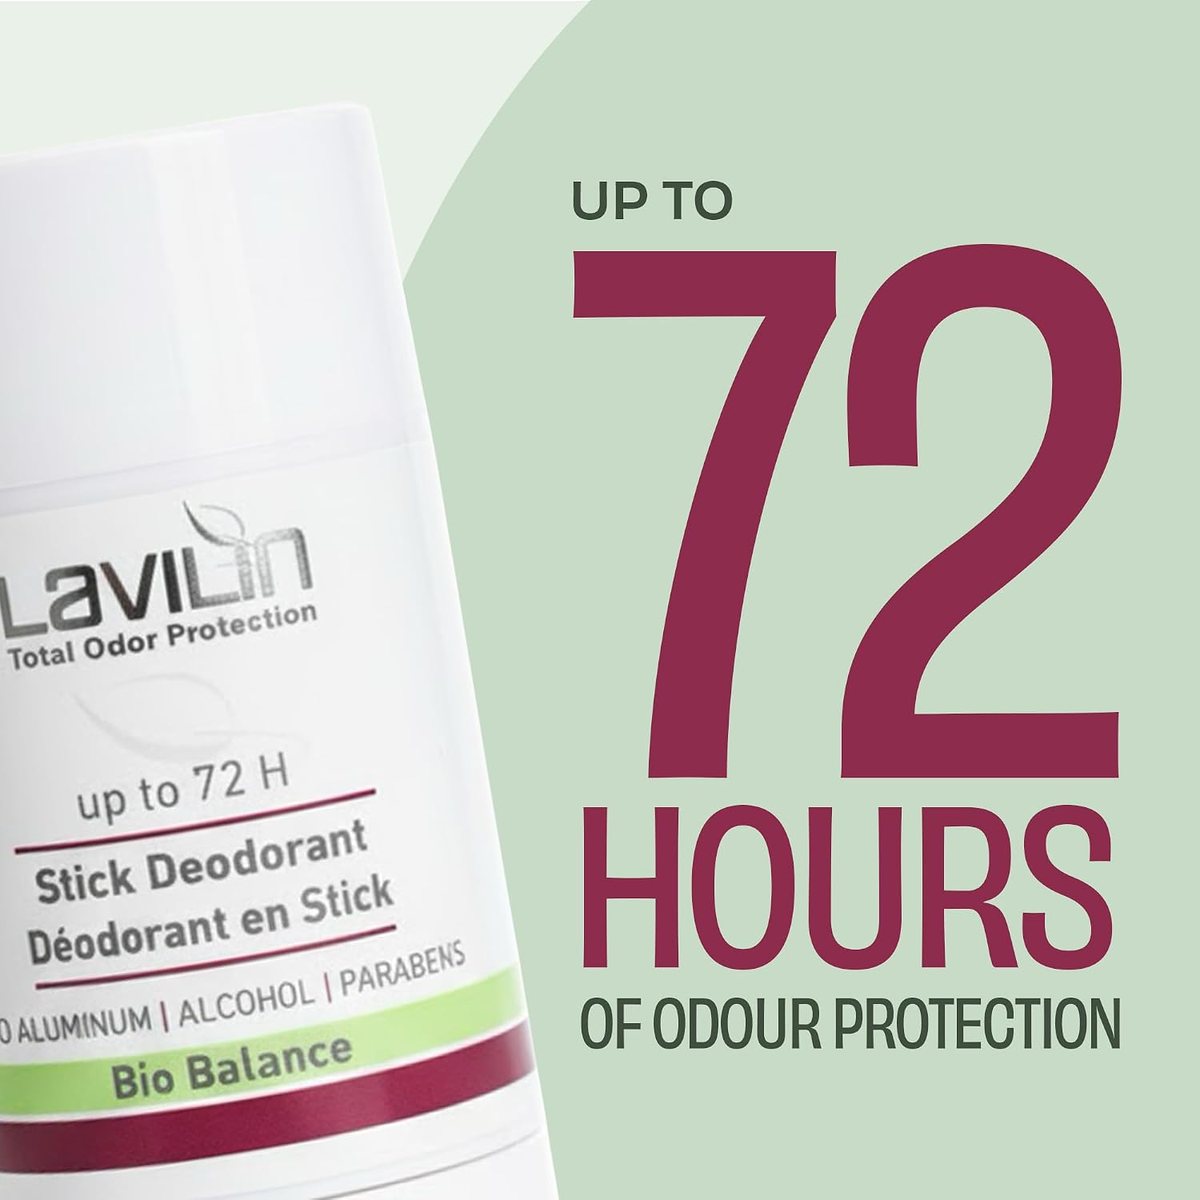
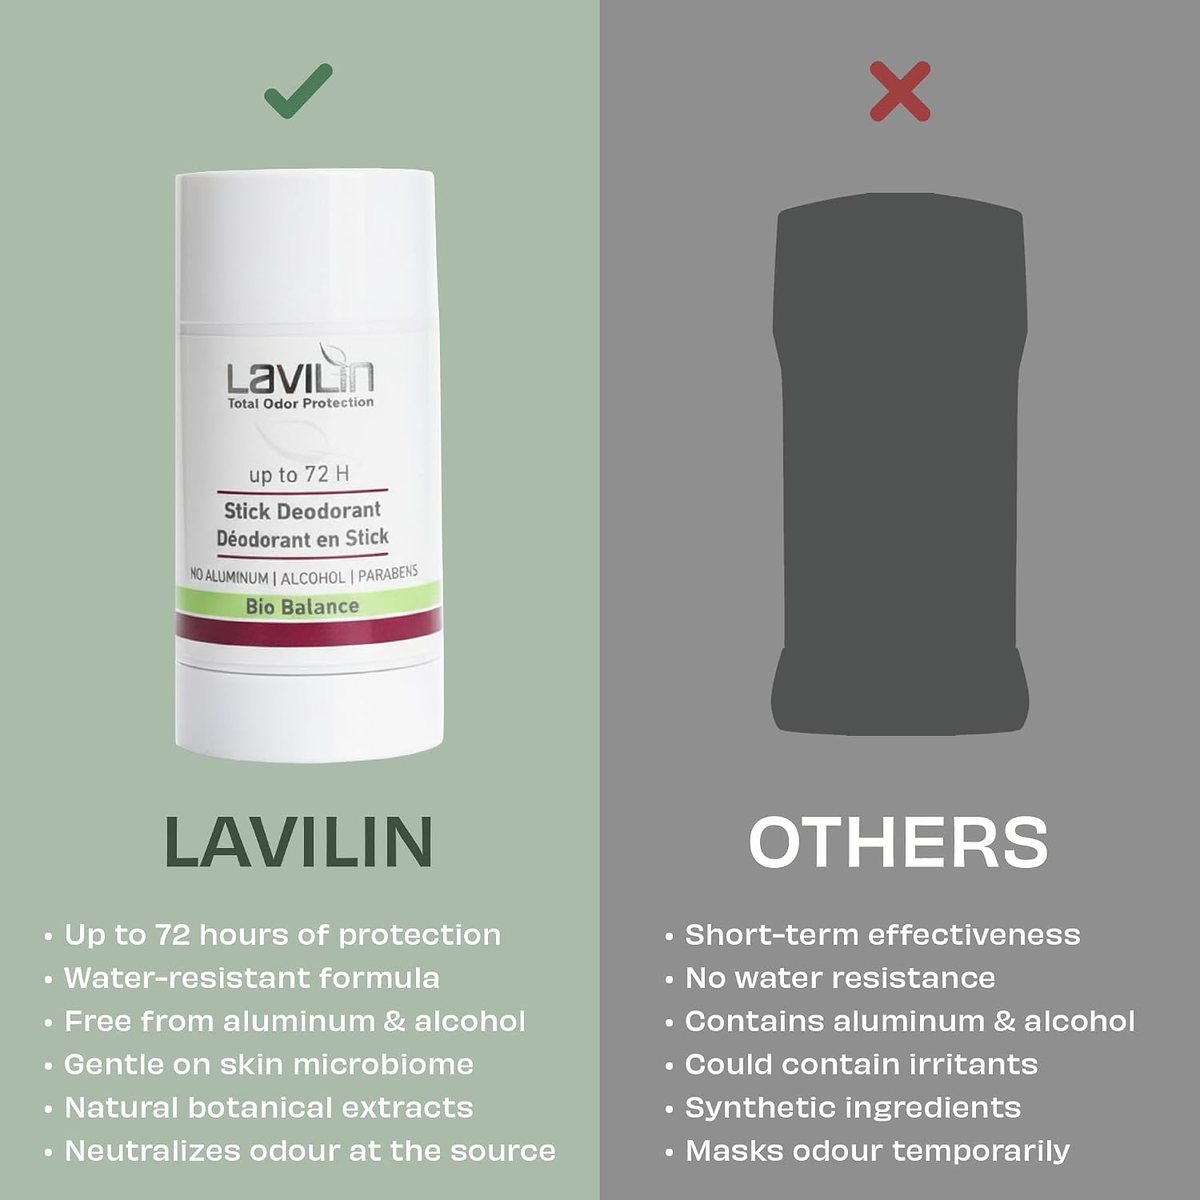
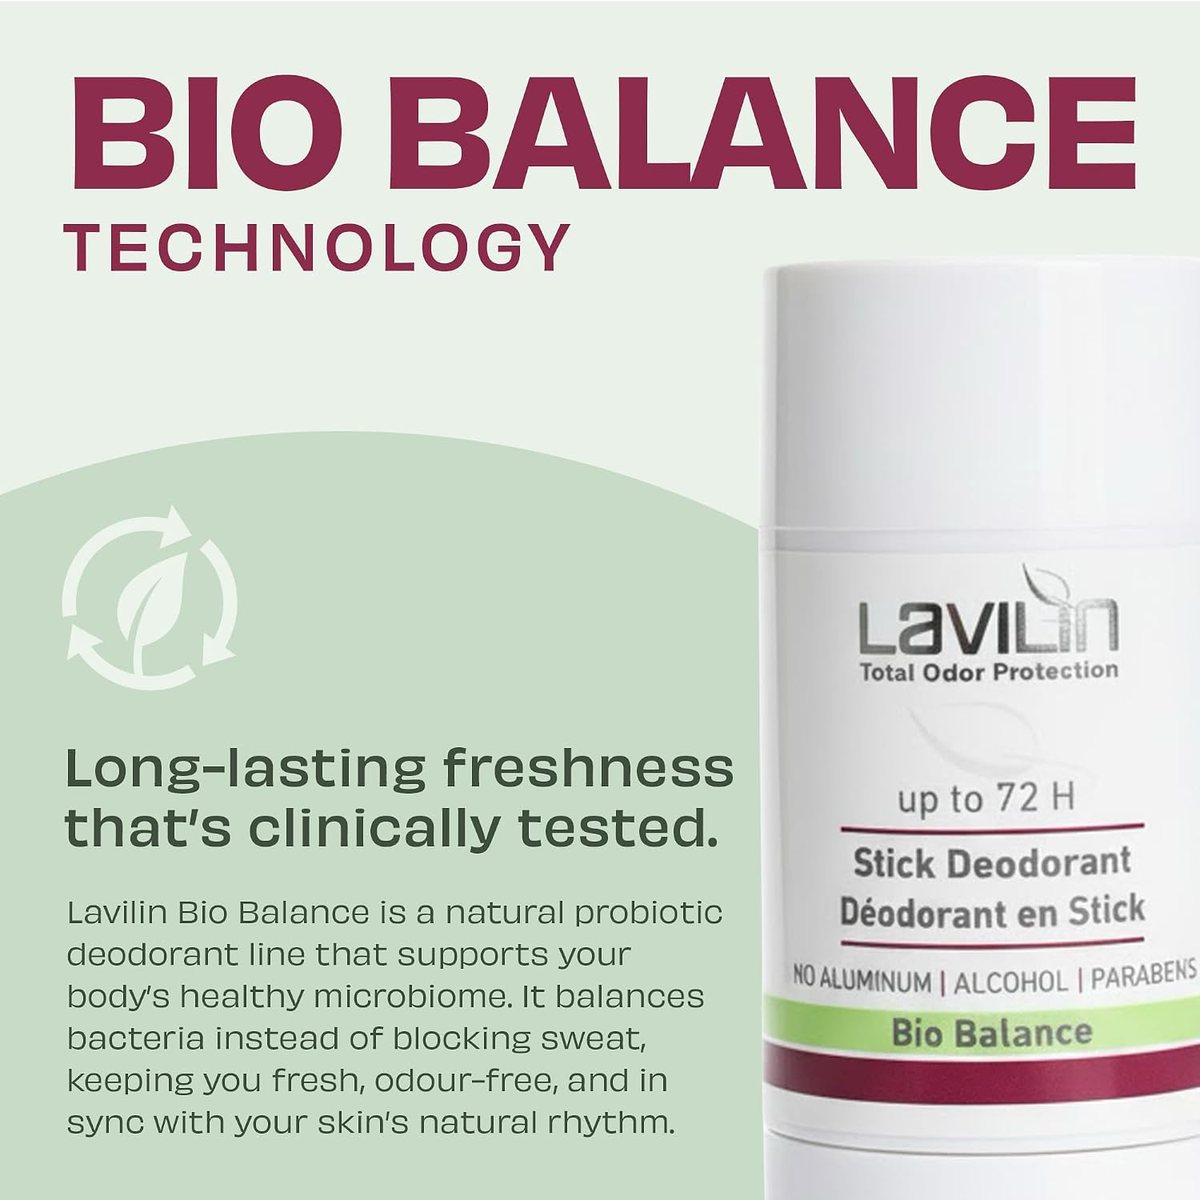
New listings first. We built the image stack from scratch around the thing that actually sells this product: the mechanism. What Bio Balance is and how it differs from blocking sweat. The key ingredients named and explained. A direct comparison against conventional deodorants on the six dimensions that matter to someone who has already decided aluminium is not for them. The 72-hour claim stated plainly, and the water and sweat resistance proven rather than asserted.
In personal care, most of the category sells on lifestyle. This product had a real technical argument, so we made the argument.
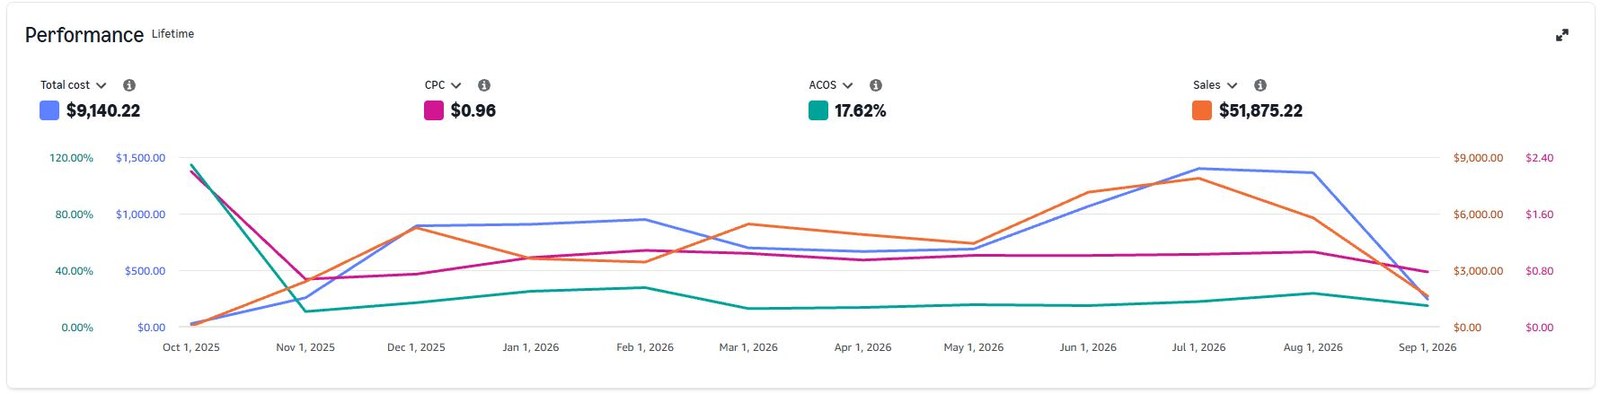
Then traffic, carefully. Advertising launched from zero, with campaign structure built around where purchase intent actually sat rather than spraying budget across the category. Bids held tight, cost per click kept to $0.96, waste negated early instead of after it compounded. Total spend across the full year came to $9,140, a figure most agencies would burn in a month and call it testing.
Twelve months before, twelve months after
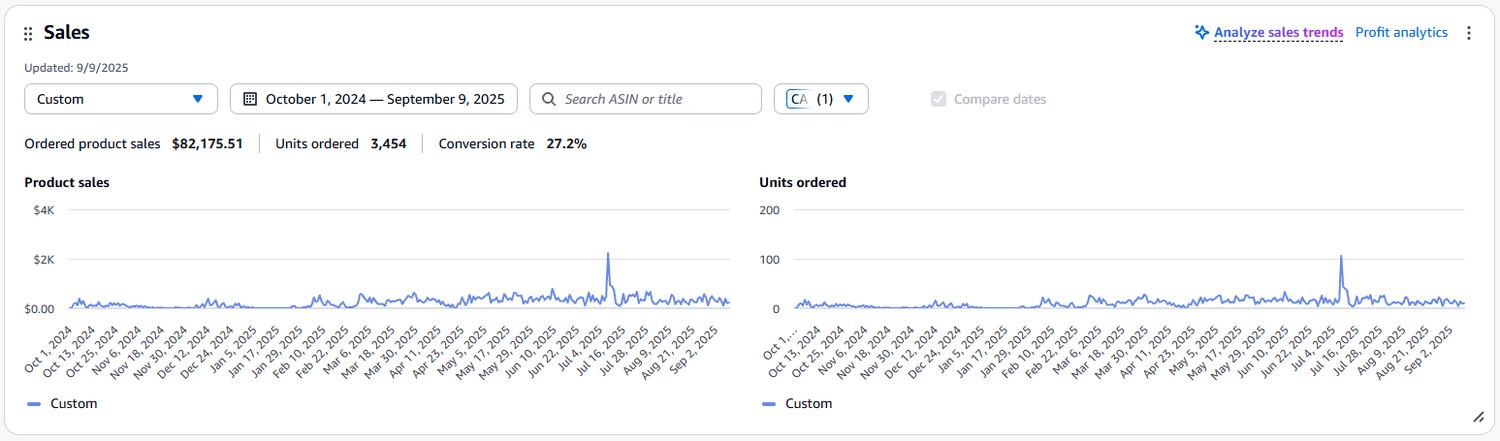
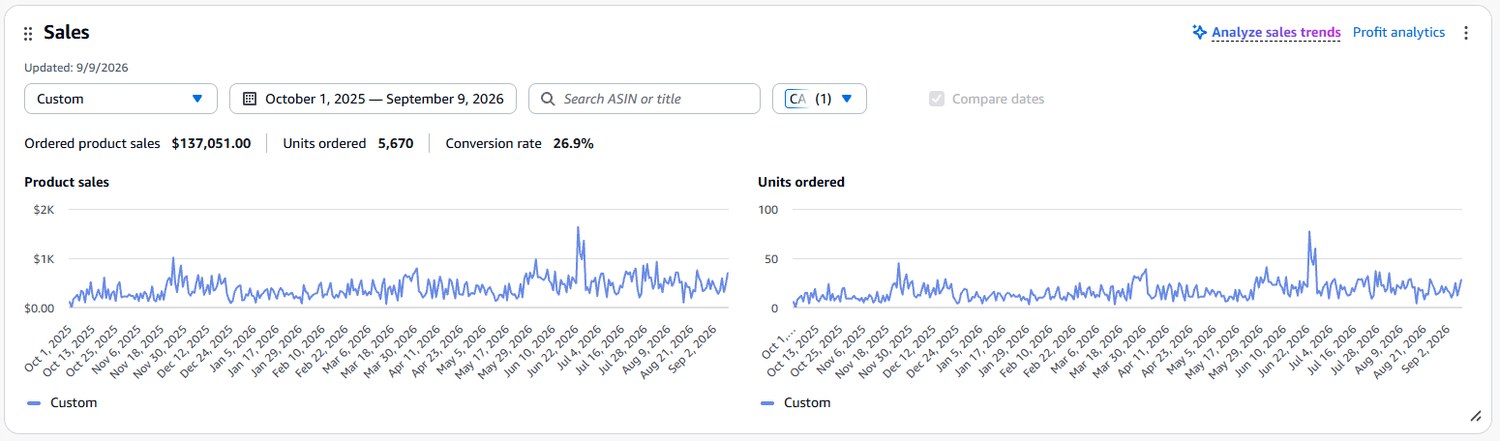
Straight from Seller Central


The listing we rebuilt



The result
Sales over the twelve months from October 2025 reached $137,051, against $82,175 in the same twelve months a year earlier. Same product, same marketplace, same seasons. $54,875 of new revenue, up 66.8%, and 2,216 more units sold.
That cost $9,140 in advertising. Every dollar produced roughly six dollars of incremental revenue, at 17.62% ACoS and 6.7% TACoS.
The quiet result is the conversion rate. It sat at 27.2% before and 26.9% after, and holding a number that high while unit volume grows 64% is harder than it looks. Scaling traffic normally drags conversion down, because the new visitors are a broader and less-qualified audience than the ones who were already finding you. The rebuilt listing absorbed all that extra traffic without losing a point of efficiency.
Advertising accounted for only 38% of total sales. The other 62% came organically, which is what happens when paid traffic builds rank rather than renting it.
The numbers
Want numbers
like these?
Twenty minutes on your listings and ad account. We'll show you where the spend is leaking and what it's worth to fix.